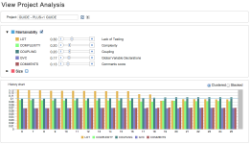
 Quality Monitor™ code analysis: the view shows quality indicators of a system evolving over versions.
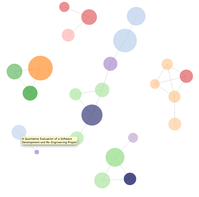
 Quality Monitor™ static dead code and dynamic test coverage analyses: the view (by yWorks) shows that all tests worked fine (green), but some classes (boxes) are not covered (blue). Among those there are many ”dead” (light blue) classes, i.e., they cannot be tested.
Kvalitetsmonitor för publikationer
Kvalitetsmonitorn bedömer automatiskt våra Publikationer och hämtar tillförlitlig information som är användbar för såväl läsare som författare.
Läsare har nytta eftersom de kan
- Se bästa publikationer i korthet möjliggör målinriktad läsning,
- Förstå likheter mellan publikationer för att undvika läsa artiklar i onödan,
- Spåra referenser mellan publikationer för att hitta grundläggande artiklar direkt.
- Optimera vår publikationstrategi,
- Hitta och fixa fel omgående.

|
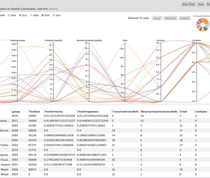
Kvaliteten på våra Publikationer. För varje publikation analyserar vi antalet citeringar (vikt 28%), rykte av respektive konferens/tidskrift (vikt 28%), hur centralt artikeln är bland våra publikationer (vikt 11%), hur komplett meta-information är och om en PDF fil är tillgängliga (vikt 11%), hur gammal artikeln är (negativ vikt 11%), och slutligen hur unik den är (vikt 11%). |

|
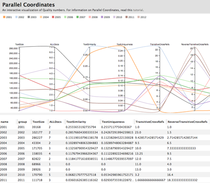
Kvaliteten på våra Publikationer aggregerad till respektive publiceringsår. |
|
Metriker på våra Publikationer. |
|
Metriker på våra Publikationer aggregerad till respektive publiceringsår. |
|
Kopior mellan våra Publikationer. |
|
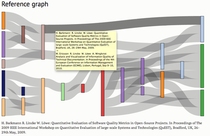
Referenser mellan våra Publikationer. |

